
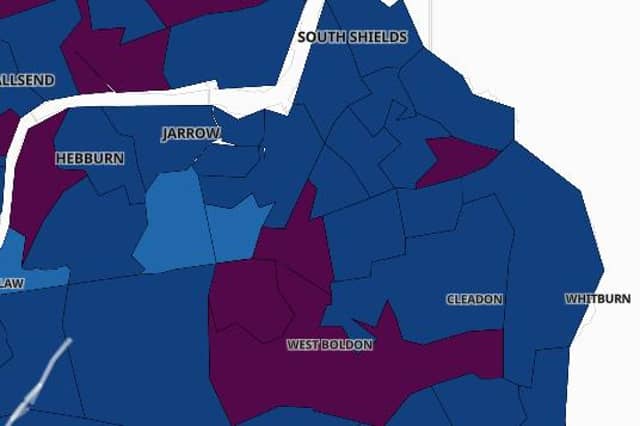
Coronavirus cases in South Tyneside have dropped since the start of the month however in some areas, infection rates continue to remain high.
In the seven days leading up to November 17, the borough recorded a case rate of 340.1 per 100,000 people, with 945 positive cases recorded.
By comparison, on November 1, South Tyneside had a case rate of 461.4 per 100,000 after 1,282 were recorded in the week leading up to that date.
The most recent data shows that West Boldon is the worst affected area of South Tyneside, with a rate of 553.8 per 100,000 people.
However Whiteleas has seen the biggest increase in cases leading up to November 17, with a rise of 66.7%.
Data for the last five days is not included as it may not yet be complete or accurate.
Here we reveal the areas of South Tyneside that have the highest Covid-19 case rates per 100,000 people in the seven days leading up to November 17.
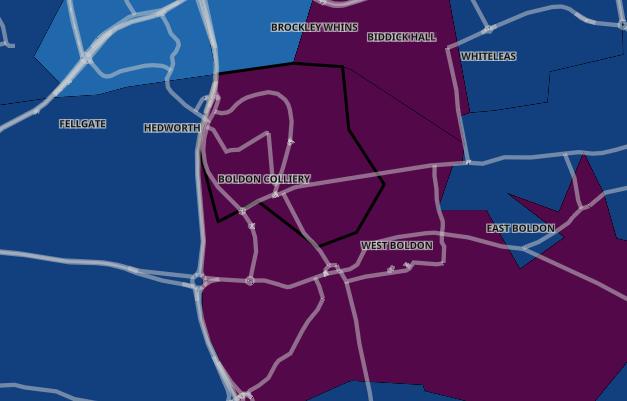
5. Boldon Colliery
In the seven days up to November 17, Boldon Colliery recorded a case rate of 406.2 per 100,000 people. A total of 24 cases were recorded - a rise of 50% than the previous week. Photo: Gov.uk
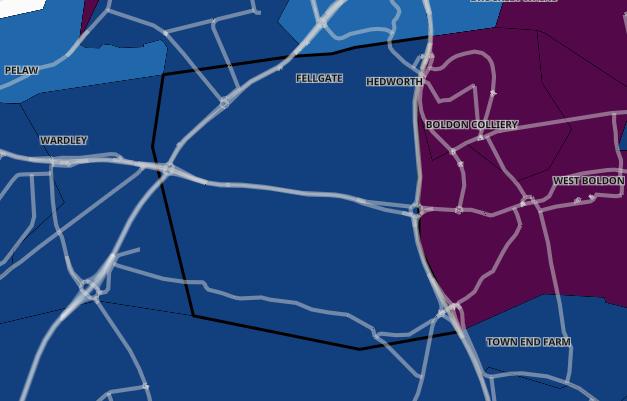
6. Fellgate and Hedworth
In the seven days up to November 17, Fellgate and Hedworth recorded a case rate of 388.2 per 100,000 people. A total of 21 cases were recorded - a rise of 23.5% than the previous week. Photo: Gov.uk
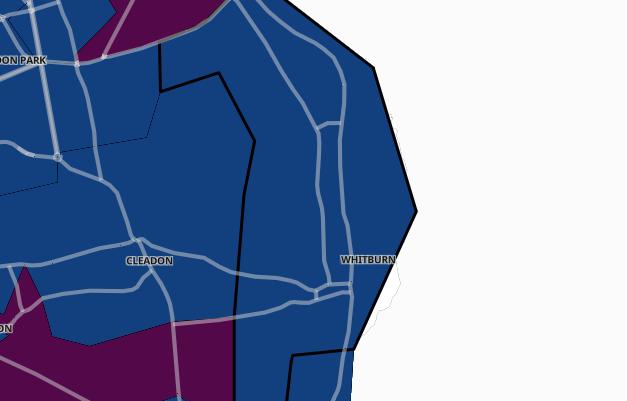
7. Whitburn and Marsden
In the seven days up to November 17, Whitburn and Marsden recorded a case rate of 385.7 per 100,000 people. A total of 30 cases were recorded - a rise of 3.4% than the previous week. Photo: Gov.uk
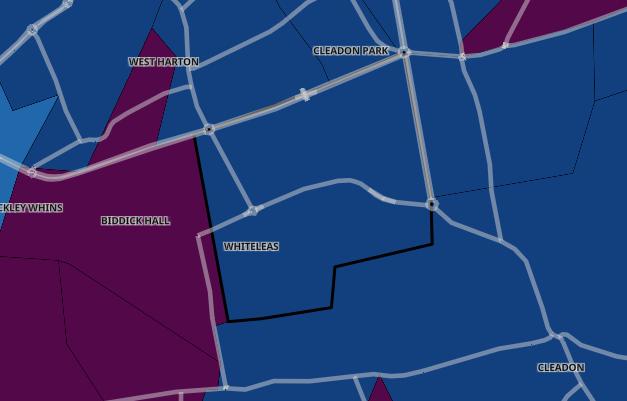
8. Whiteleas
In the seven days up to November 17, Whiteleas recorded a case rate of 368.4 per 100,000 people. A total of 25 cases were recorded - a rise of 66.7% than the previous week. Photo: Gov.uk