
According to latest government data, South Tyneside recorded a rate of 434.1 cases per 100,000 people in the seven days leading up to March 17 – with 656 people testing positive for the virus.
By comparison, at the start of the month, the borough had a rate of 207.8 per 100,000 people, equating to 314 cases over the seven day period leading up to March 1.
Currently, Cleadon and East Boldon are the worst affected areas, with a rate of 647.1 cases per 100,000 people.
Data for the last five days is unavailable as it may be inaccurate or incomplete.
Here we reveal the areas of South Tyneside where Covid-19 cases that have seen the biggest increase in cases in the week leading up to March 17.
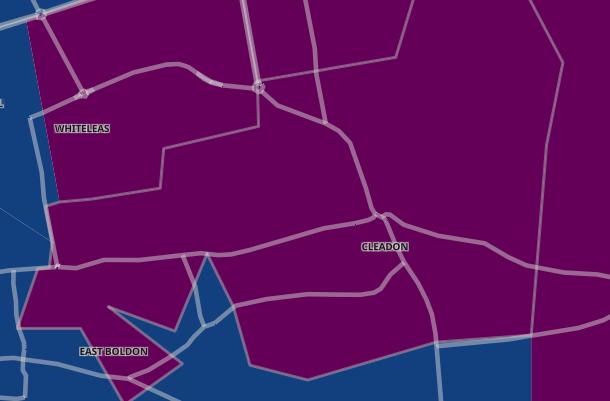
1. Cleadon and East Boldon
In the seven days up to March 17, Cleadon and East Boldon recorded a case rate of 647.1 per 100,000 people. A total of 37 cases were recorded - a rise of 68.2% from the previous week. Photo: Gov.uk
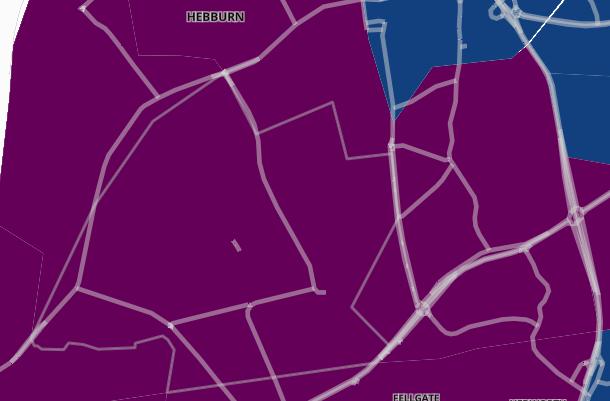
2. Hebburn South
In the seven days up to March 17, Hebburn South recorded a case rate of 604.5 per 100,000 people. A total of 59 cases were recorded - a rise of 73.5% from the previous week. Photo: Gov.uk
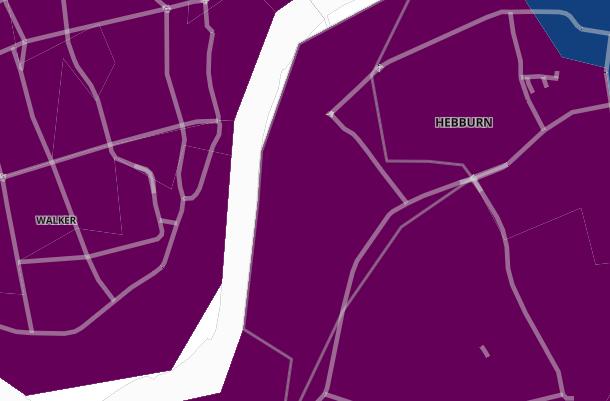
3. Hebburn West
In the seven days up to March 17, Hebburn West recorded a case rate of 579.7 per 100,000 people. A total of 37 cases were recorded - a rise of 85% from the previous week. Photo: Gov.uk
4. South Shields East
In the seven days up to March 17, South Shields East recorded a case rate of 574.4 per 100,000 people. A total of 49 cases were recorded - a rise of 250% from the previous week. Photo: Gov.uk