
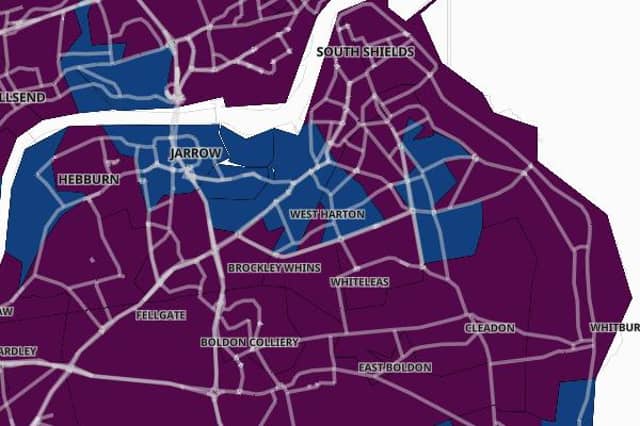
Covid-19 cases have been continuing to rise across South Tyneside – with 711 new cases recorded in the week up to October 28.
On October 28, the borough had a case rate of 470.4 per 100,000 people.
Latest figures from the Government show that Fellgate and Hedworth is the worst affected area of South Tyneside, with a rate of 739.5 per 100,000 people.
By comparison, at the start of October, the borough had a Covid-19 case rate of 290.5 per 100,000 people – with 439 cases in the seven day period leading up to October 1.
Data for the last five days is not included as it may not yet be complete or accurate.
Here we reveal the areas of South Tyneside that have the highest Covid-19 case rates per 100,000 people in the seven days leading up to October 28.
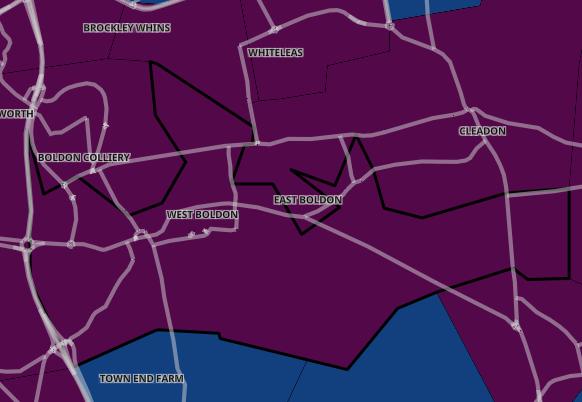
9. West Boldon
In the seven days up to October 28, West Boldon recorded a case rate of 472.4 per 100,000 people. A total of 29 cases were recorded - a rise of 38.1% than the previous week. Photo: Gov.uk
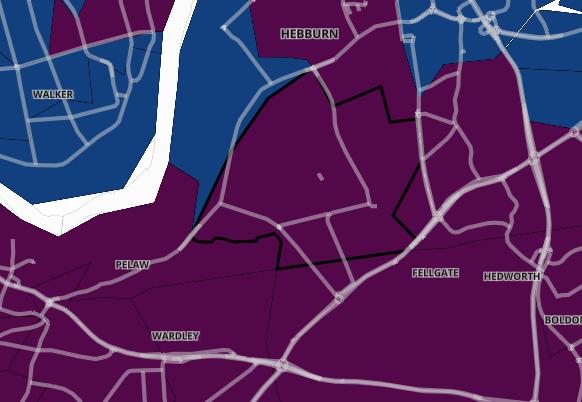
10. Hebburn South
In the seven days up to October 28, Hebburn South recorded a case rate of 471.3 per 100,000 people. A total of 46 cases were recorded - a drop of 6.1% than the previous week. Photo: Gov.uk
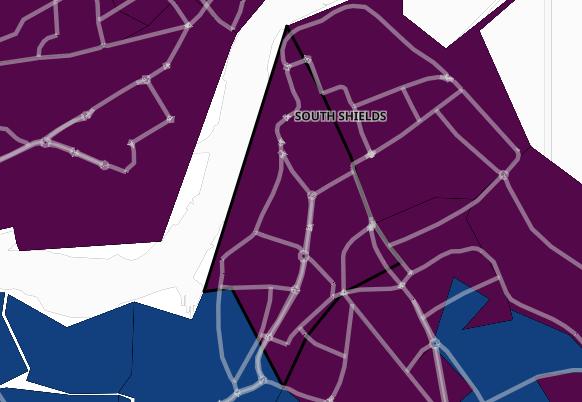
11. South Shields West
In the seven days up to October 28, South Shields West recorded a case rate of 457.3 per 100,000 people. A total of 38 cases were recorded - a rise of 18.8% than the previous week. Photo: Gov.uk
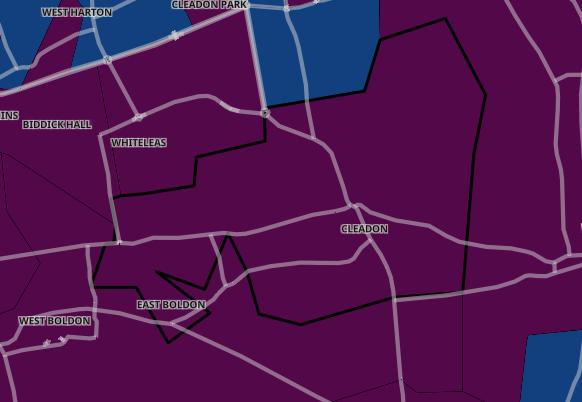
12. Cleadon and East Boldon
In the seven days up to October 28, Cleadon and East Boldon recorded a case rate of 437.2 per 100,000 people. A total of 25 cases were recorded - a rise of 47.1% than the previous week. Photo: Gov.uk