

According to the latest government data, South Tyneside recorded a rate of 637.8 cases per 100,000 in the seven days leading up to April 2 – with 964 people testing positive for the virus.
By comparison, when cases peaked on March 27, the borough had a rate of 756.9 per 100,000 people, equating to 1,144 cases over the seven day period.
Currently, Westoe is the worst affected area with 975.3 cases per 100,000 people.
Data for the last five days is unavailable as it may be inaccurate or incomplete.
Here we reveal the areas of South Tyneside where Covid-19 cases that have seen the biggest increase in cases in the week leading up to April 2.
Currently, Westoe is the worst affected area with 975.3 cases per 100,000 people.
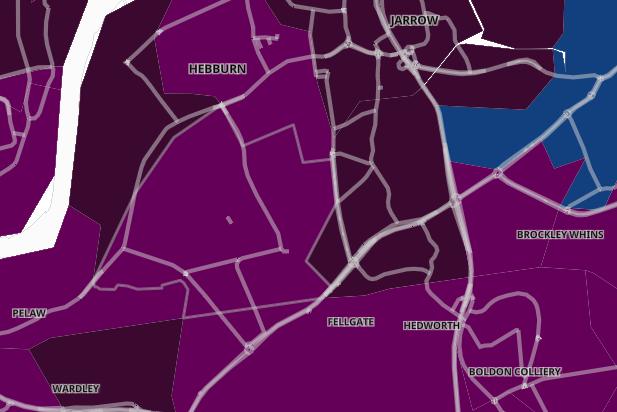
5. Hebburn South
In the seven days up to April 2, Hebburn South recorded a case rate of 788.9 per 100,000 people. A total of 77 cases were recorded - a drop of 10.5% from the previous week. Photo: Gov.uk
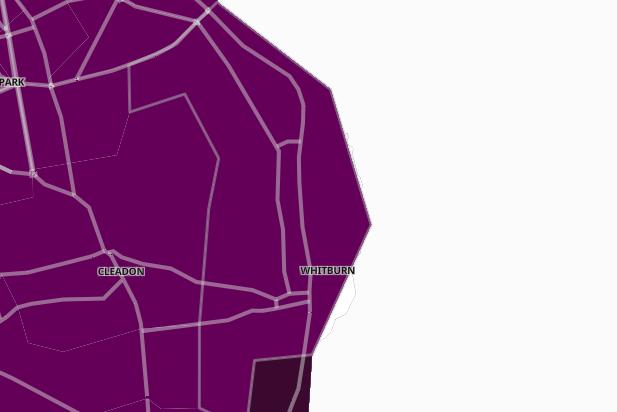
6. Whitburn and Marsden
In the seven days up to April 2, Whitburn and Marsden recorded a case rate of 707 per 100,000 people. A total of 55 cases were recorded - no change from the previous week. Photo: Gov.uk
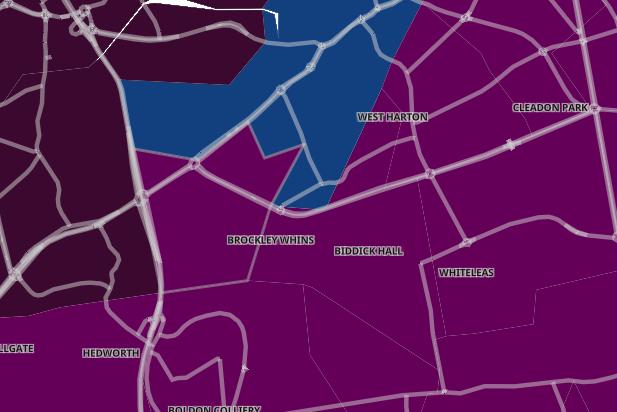
7. Brockley Whins
In the seven days up to April 2, Brockley Whins recorded a case rate of 687.7 per 100,000 people. A total of 37 cases were recorded - a rise of 12.1% from the previous week. Photo: Gov.uk
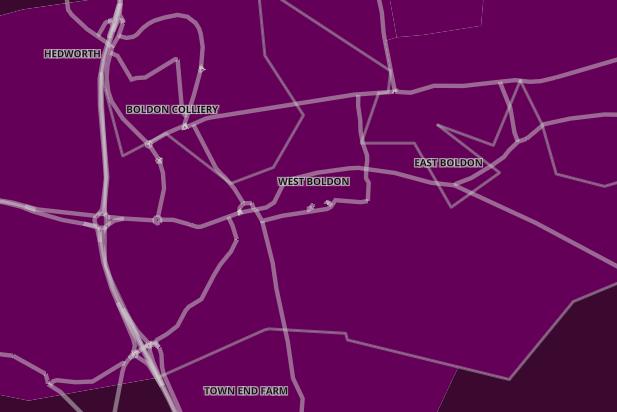
8. West Boldon
In the seven days up to April 2, West Boldon recorded a case rate of 684.2 per 100,000 people. A total of 42 cases were recorded - a drop of 10.6% from the previous week. Photo: Gov.uk