


The coronavirus pandemic caused an unprecedented economic shock in the UK, closing businesses and putting people out of work left, right and centre.
But despite that, average house prices held up across England – even if there was a drop in the number of sales.
It was a slightly different picture in South Tyneside, however, where overall prices fell by 2.3% in the year to September 2020. Whereas across the North East, prices rose by 0.7%.
The ONS also publishes house price figures by Middle Layer Super Output Areas (MSOAs) – small geographic areas containing an average of 7,200 people.
These show 10 of the 23 MSOAs that make up South Tyneside saw a rise in house prices over the same period.
Here we reveal which neighbourhoods saw the strongest growth in the year to September 2020.
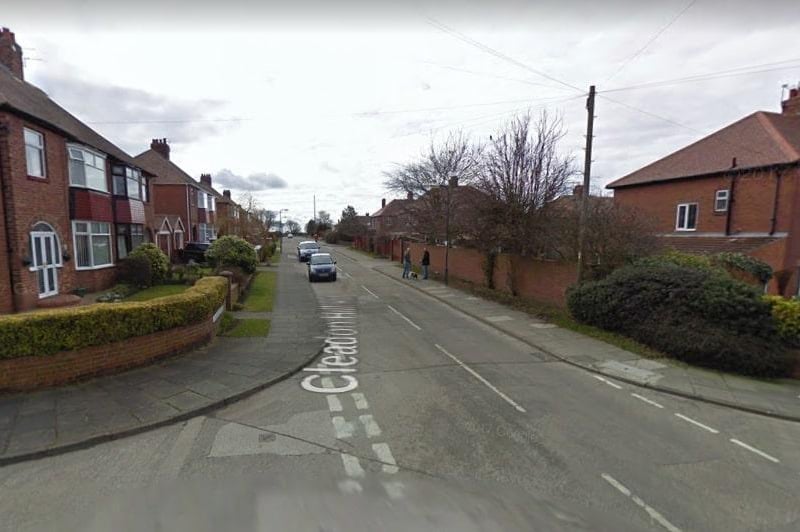
1. Cleadon Park
The biggest price hike was in Cleadon Park where the average price rose from £156,957 to £188,415 (up by 20%) on the year to September 2020. Overall, 58 houses changed hands here between October 2019 and September 2020, a rise of 4%. Photo: Google
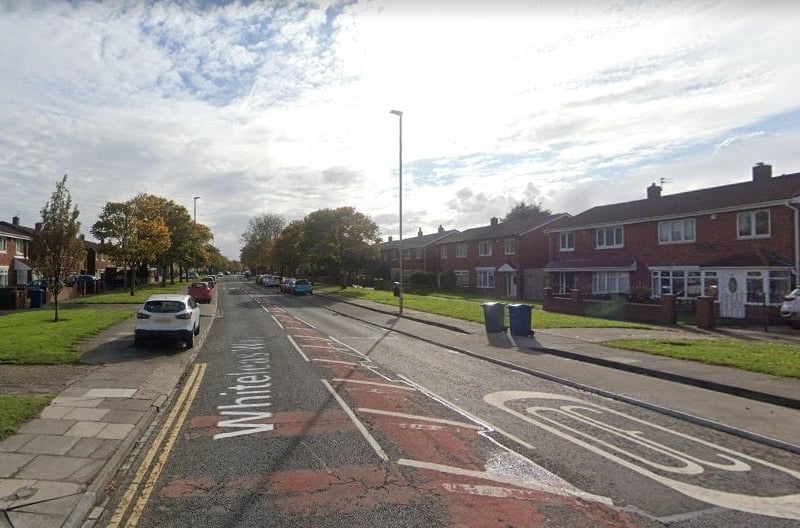
2. Whiteleas
In Whiteleas the average house price rose from £105,149 to £125,759 (up by 19.6%) in the year to September 2020. Overall, 58 houses changed hands here between October 2019 and September 2020, a fall of 2%. Photo: Google
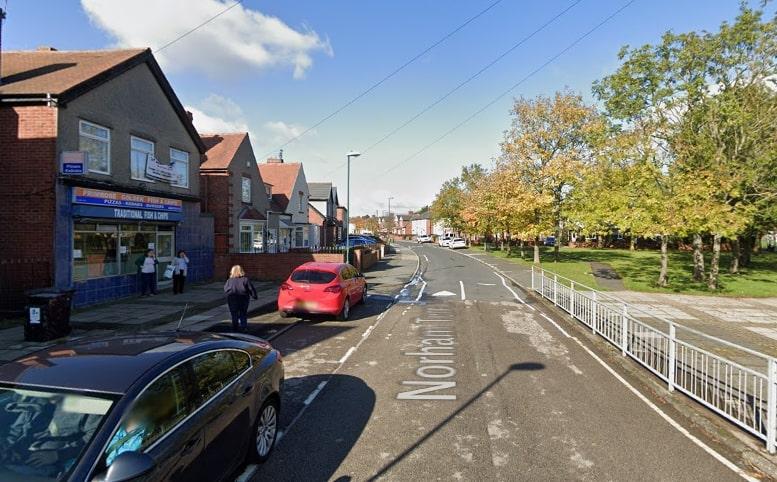
3. Primrose
In Primrose the average house price rose from £139,764 to £150,946 (up by 8%) in the year to September 2020. Overall, 36 houses changed hands here between October 2019 and September 2020, a fall of 38%. Photo: Google
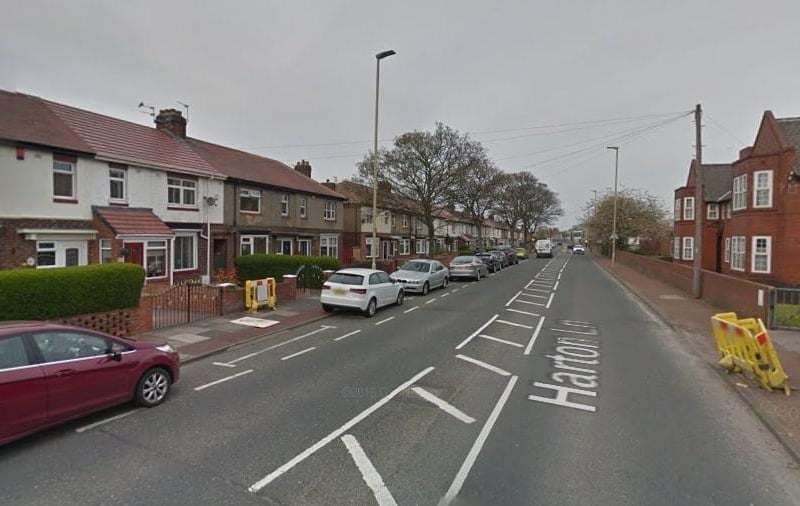
4. West Harton
In West Harton the average house price rose from £100,903 to £108,055 (up by 7.1%) in the year to September 2020. Overall, 54 houses changed hands here between October 2019 and September 2020, a fall of 10%. Photo: Google