The official statistics cover March 2020 and have been released by the Home Office on its www.police.uk website. All addresses are in South Shields unless otherwise stated. February’s figures are available here.
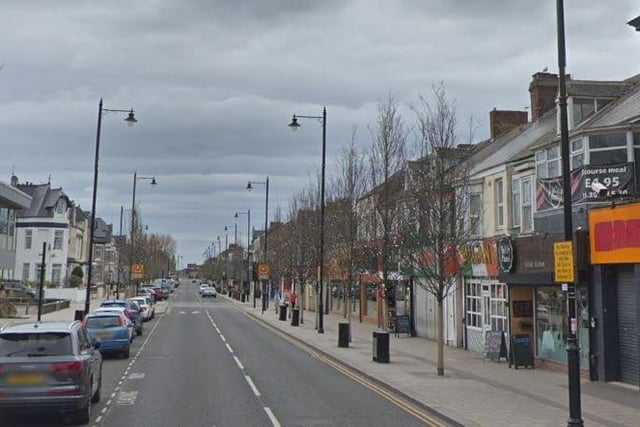
1. Ocean Road
Twenty-seven incidents in the town centre area of the road included six anti-social behaviour complaints and three violence and sexual offences (classed together). Photo: Gavin Ledwith
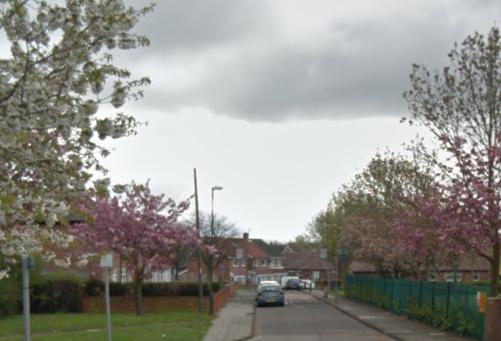
2. Wilkinson Avenue, Hebburn
Fifteen offences included eight criminal damage and arson incidents (classed together) and five anti-social behaviour reports. Photo: Other 3rd Party
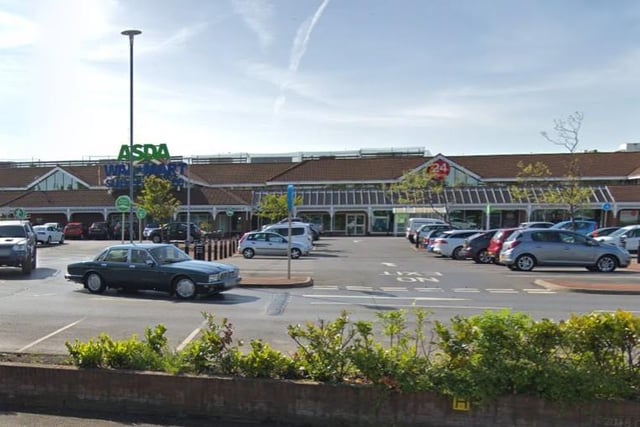
3. Hubert Street, Boldon Colliery
Thirteen incidents included 10 shoplifting complaints. Photo: Other 3rd Party
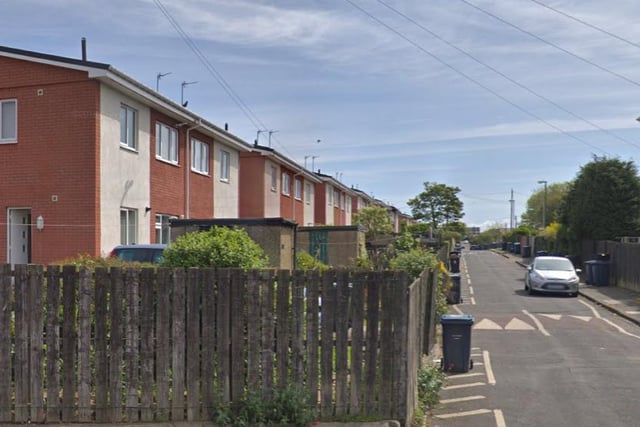
4. Horsley Hill Square
Eleven incidents included four anti-social behaviour reports and one criminal damage and arson case (classed together). Photo: Other 3rd Party
