
North East boroughs including South Shields see surge in population thanks to 'international migration'

The UK population is estimated to have grown by more than three-quarters of a million in the year to June 2024, the second largest annual numerical increase since the late 1940s, new figures show.
South Tyneside has seen its population increase to 151,393; 0.85% from 150,124, while the case was similar in neighbouring boroughs Sunderland 288,606;1.76% from 283606, Gateshead (202,760; 1.08% from 200,597), Newcastle upon Tyne (320,605; 2.26% from 313,522), and North Tyneside (215,025; 1.09% from 212,705).


The jump was driven almost entirely by international migration, with natural change – more births than deaths – responsible for only a tiny proportion.
A record 69.3 million people were estimated to be in the UK in mid-2024, up 755,254 (1.1%) from 68.5 million in mid-2023, according to the Office for National Statistics (ONS).

Net international migration – the difference between people moving to the country and leaving – contributed most to population growth in all four nations of the UK, the ONS said.
Some 1,235,254 people were estimated to have immigrated to the UK in the 12 months to June 2024 while 496,536 were likely to have emigrated, meaning net migration was 738,718.
This accounted for 98% of the UK’s overall increase in population across this period.
There were slightly more births (662,148) than deaths (645,909) in the year to mid-2024, which added just 16,239 to the total.
The overall increase of 755,254 is the second biggest year-on-year numerical jump in population since at least 1949, which is the earliest comparable ONS data.
It is behind only the rise of 890,049 that took place in the preceding 12 months from mid-2022 to mid-2023.
This means the UK population is estimated to have grown by 1.6 million between June 2022 and June 2024: the largest two-year jump since current records began.
Nigel Henretty of the ONS said: “The UK population has increased each year since mid-1982.
“Net international migration continues to be the main driver of this growth, continuing the long-term trend seen since the turn of the century.
“The rate of population increase has been higher in recent years, and the rise seen in the year to mid-2024 represents the second largest annual increase in numerical terms in over 75 years.”
Along with new population figures for 2024, the ONS has revised its estimates for 2011 to 2023 in line with the latest available migration data.

They show the UK population grew by 4.7 million in the decade from mid-2014 to mid-2024, a rise of 7.2%.
This is a slightly slower rate of growth than in the preceding 10 years from 2004 to 2014, which was 7.8%.
Growth has been notably higher in the 21st century than during the second half of the 20th century, however.
The UK population stood at 50.3 million in 1949 and took 19 years to reach 55 million (in 1968) and a further 37 years to hit 60 million (2005).
It then took only 10 years to increase from 60 million to 65 million (2015).
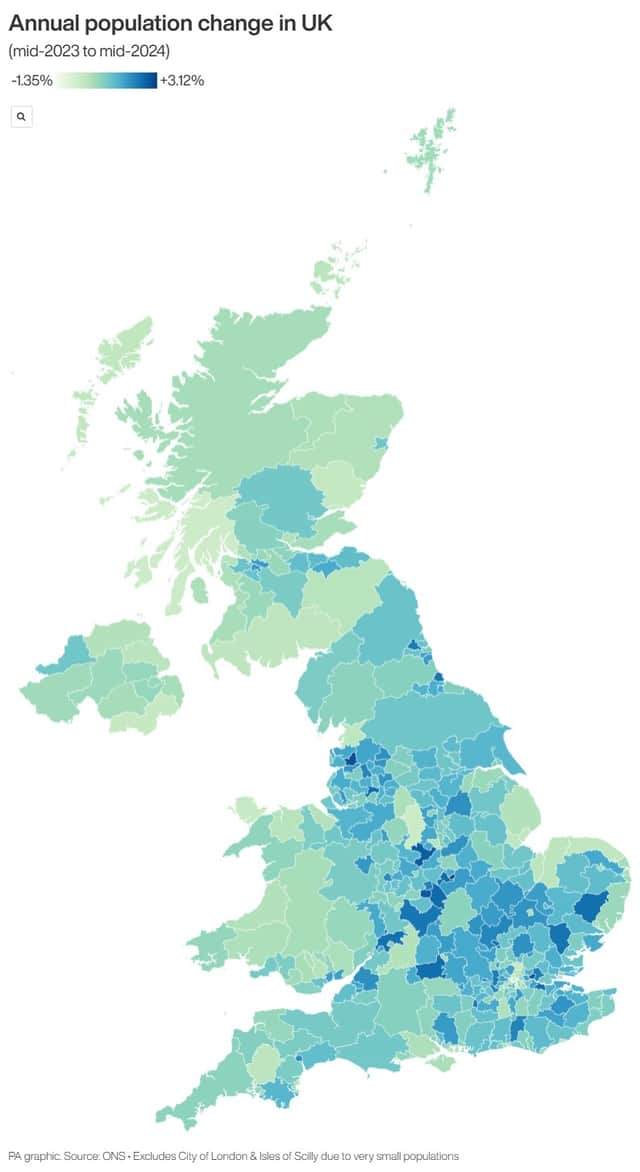
The rate of growth in the most recent 12-month period has not been consistent across the UK.
There was faster rate in England in the year to June 2024 (1.2%) than in Scotland (0.7%), Wales (0.6%) or Northern Ireland (0.4%).
Both Wales and Scotland saw negative natural change – more deaths than births – in this period.
“The population of Wales and Scotland is older on average than the population of England or Northern Ireland, leading to a slightly higher rate of deaths and lower rate of births,” the ONS said.
“The average number of children that are born to women in Wales and Scotland is also lower than the rest of the UK, which contributes to fewer births.”

The total number of births in the UK in the year to mid-2024, 662,148, was the lowest for at least 42 years, while the number of deaths, 645,909, was the lowest since mid-2019, before the Covid-19 pandemic.
At a local authority level, Glasgow saw the largest percentage increase in population in Scotland in the year to mid-2024 (1.8%), Newport had the largest rise in Wales (1.7%) and Derry City & Strabane had the largest jump in Northern Ireland (1.0%).
The biggest drops in these three nations were Argyll & Bute (down 0.3%), Isle of Anglesey (down 0.2%) and Newry, Mourne & Down (down 0.2%) respectively.
In England, the local authorities with the largest percentage increase and decrease, City of London (11.1%) and Isles of Scilly (down 2.8%), have very small populations which means they have outlying results.
The next largest increases in England were for Oadby & Wigston in Leicestershire (3.1%), followed by Preston in Lancashire (2.9%) and Barking & Dagenham in London (2.8%).
Kensington & Chelsea in London had the next largest decrease in England (down 1.4%), followed by the London boroughs of Lambeth (down 0.6%) and Westminster (down 0.3%).
Population increases in the North East boroughs:
Sunderland (288,606; 1.76% from 283,606)
South Tyneside (151,393; 0.85% from 150,124)
Gateshead (202,760; 1.08% from 200,597)
Newcastle upon Tyne (320,605; 2.26% from 313,522)
North Tyneside (215,025; 1.09% from 212,705)
Darlington (112,489; 1.41% from 110,925)
County Durham (538,011; 0.75% from 533,997)
Hartlepool (98,180; 2.33% from 95,942)
Middlesbrough (156,161; 1.64% from 153,639)
Redcar & Cleveland (139,228; 0.81% from 138,115)
Northumberland (331,420; 1.08% from 327,865)
Stockton-on-Tees (206,800; 1.49% from 203,768)