

The figures from the Office of National Statistics cover a five-year-period from 2014 to 2019.
From Hebburn South to Fellgate and Hedworth, here’s how each area has fared in terms of a percentage change.
A Message from the Editor
Support your Gazette and become a subscriber today. Enjoy unlimited access to local news, the latest football stories and new puzzles every day. With a digital subscription, you can see fewer ads, enjoy faster load times, and get access to exclusive newsletters and content. Click here to subscribe.
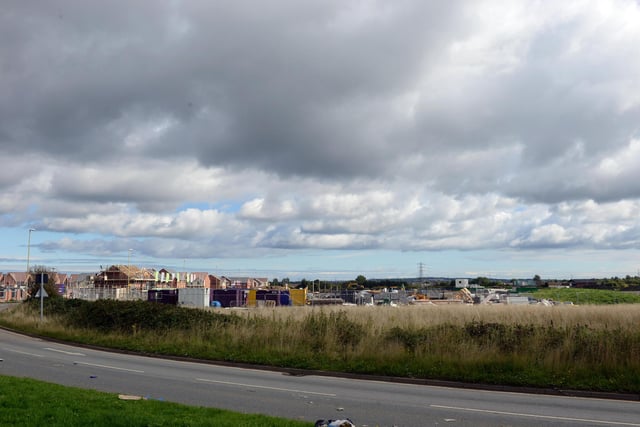
1. No 1: Hebburn South
Population in 2019: 8,600 Population in 2014: 7,465 Increase: 1,135 Percentage rise: 15.2 Photo: Stu Norton
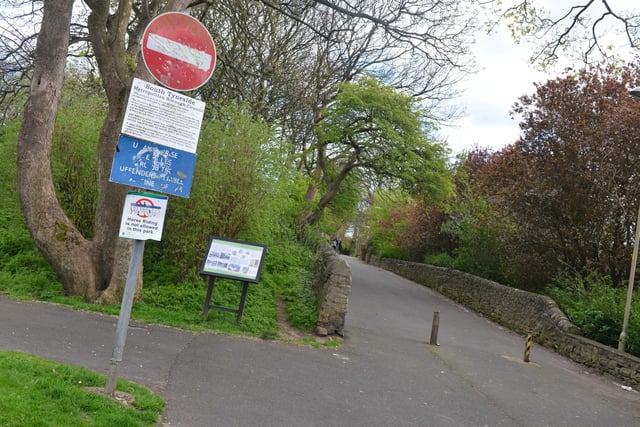
2. No 2: Cleadon Park
Population in 2019:7,700 Population in 2014: 7,141 Increase: 559 Percentage rise: 7.8 Photo: Stu Norton
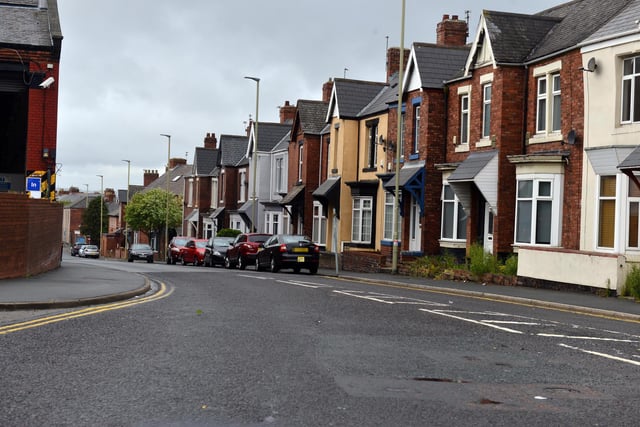
3. No 3: No 3: Simonside and Rekendyke
Population in 2019: 9,408 Population in 2014: 8,730 Increase: 678 Percentage rise: 7.8 Photo: Stu Norton
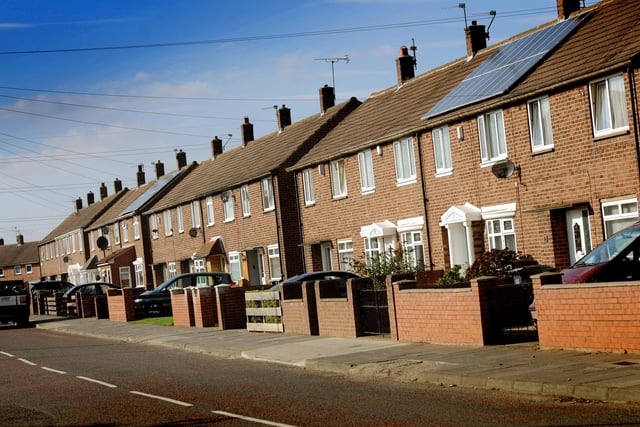
4. No 4: Biddick and All Saints
Population in 2019: 9,117 Population in 2014: 8,798 Increase: 319 Percentage rise: 3.6 Photo: Tim Richardson