
The latest house price data based on Land Registry figures for the year to March 2025 were published by the Office for National Statistics.
The figures have revealed several areas of South Tyneside were house prices have rapidly risen in the last year.
We have compiled the areas in the borough were prices have risen most from March 2024 to March 2025.
Here are the 13 South Tyneside neighbourhoods where house prices have increased the most since March 2024 to March 2025.
Support your Shields Gazette and become a subscriber today. Enjoy unlimited access to local news, the latest football stories and new puzzles every day.
With a digital subscription, you can see fewer ads, enjoy faster load times, and get access to exclusive newsletters and content.
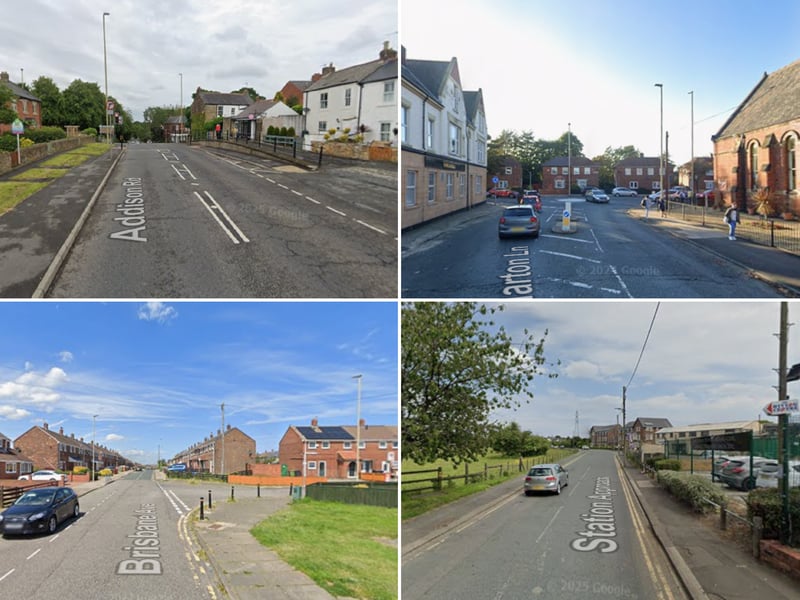
1. South Tyneside areas with the fastest rising house prices
These are the areas of South Tyneside that had the highest rising house prices up to March 2025. | Google Maps
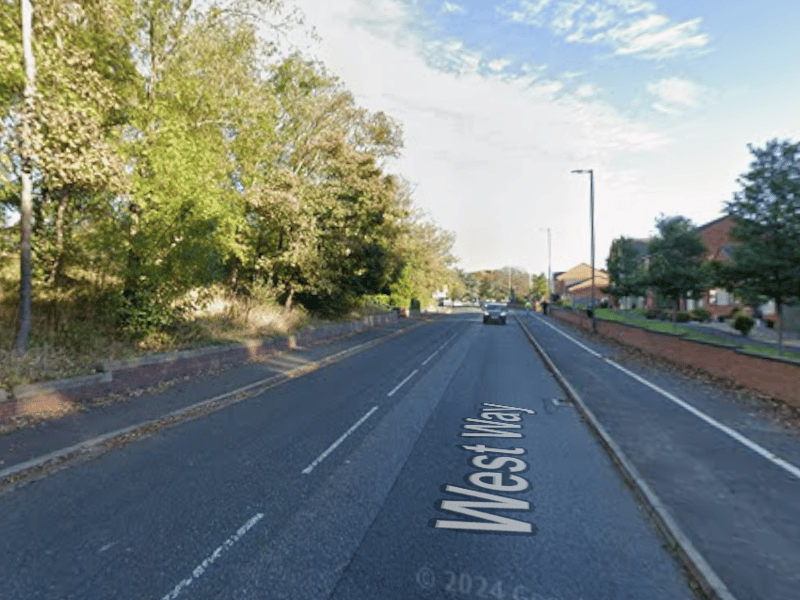
2. West Park
The average house price in West Park went up by 36% during the year ending in March 2025, to £154,342. | Google Maps
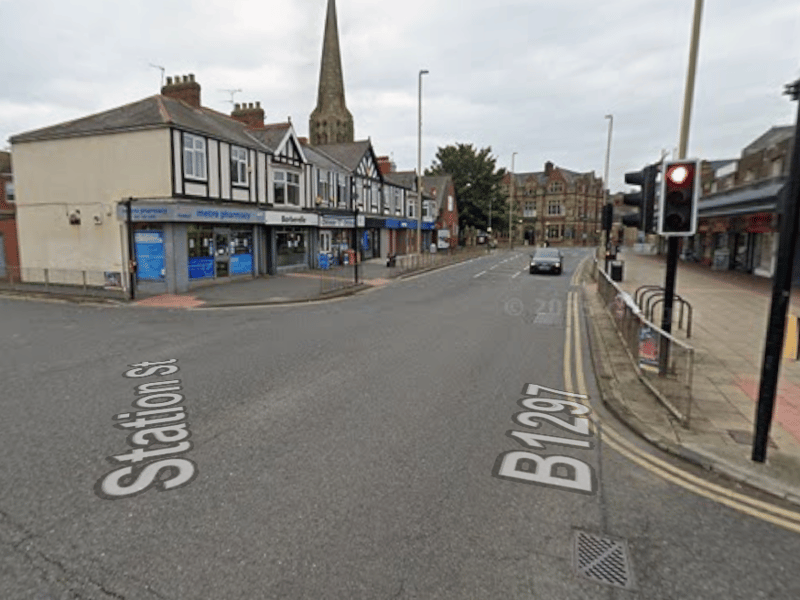
3. Jarrow Town
The average house price in Jarrow Town went up by 30% during the year ending in March 2025, to £150,000. | Google Maps
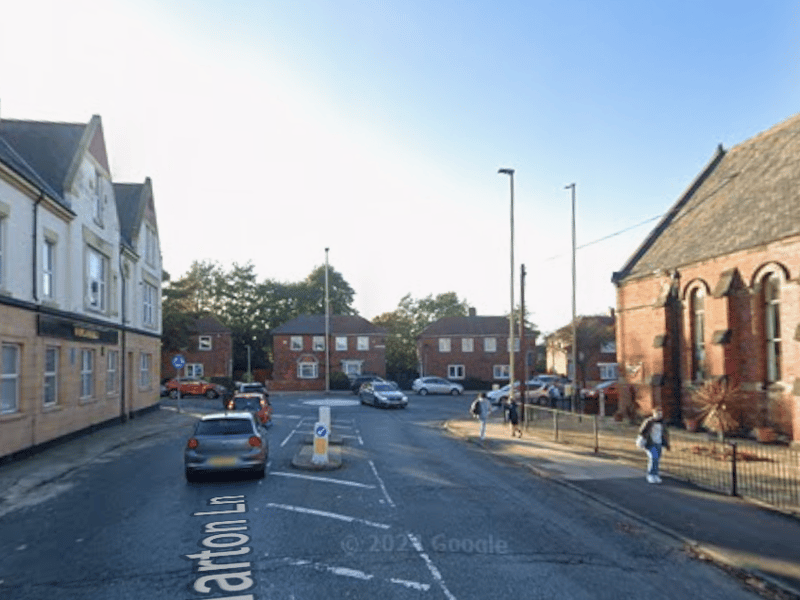
4. West Harton
The average house price in West Harton went up by 26% during the year ending in March 2025, to £107,250. | Google Maps