



Steve Bruce’s side beat the Hammers at the London Stadium on the opening weekend of last season courtesy of goals from Callum Wilson and Jeff Hendrick.
However, if supporters cast their minds back before then, they’ll know their team don’t tend to perform well during the first game of the season.
A new study by Bookmakers.TV has looked at the results of all 20 Premier League clubs across a decade of opening day fixtures – placing teams in order of best to worst.
Here’s how Newcastle compared to their English top-flight rivals:
A message from the Football Clubs Editor
Our aim is to provide you with the best, most up-to-date and most informative Newcastle United coverage 365 days a year.
This depth of coverage costs, so to help us maintain the high-quality reporting that you are used to, please consider taking out a subscription; sign up here.
Your support is much appreciated. Richard Mennear, Football Clubs Editor
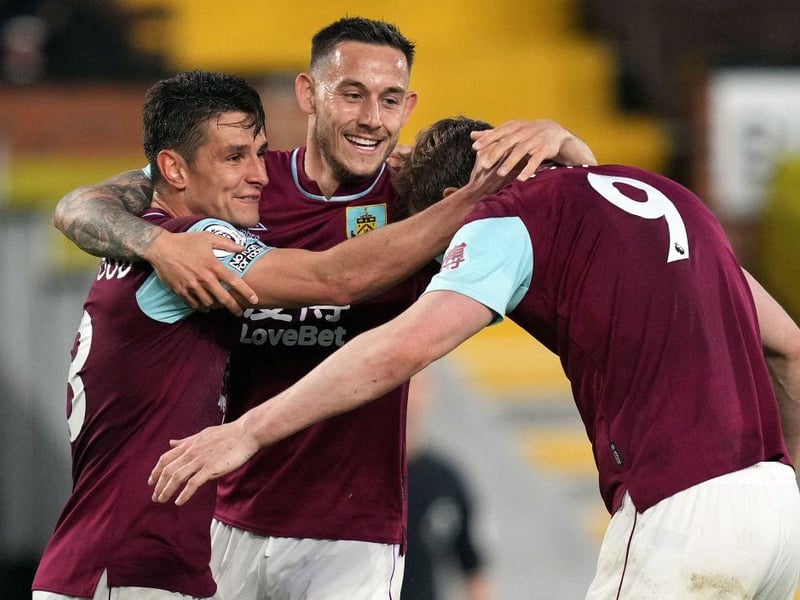
13. Burnley
Played: 10. Won: 3. Drawn: 4. Lost: 3. Goals For: 13. Goals Against: 11. Goal Difference: 2. Points: 13. Points Per Game: 1.3. Photo: JOHN WALTON
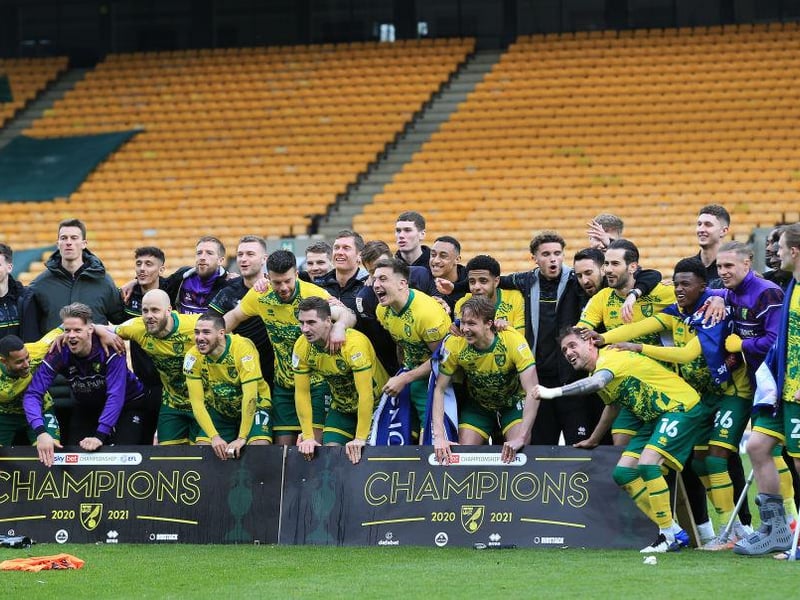
14. Norwich City
Played: 10. Won: 3. Drawn: 4. Lost: 3. Goals For: 13. Goals Against: 20. Goal Difference: -7. Points: 13. Points Per Game: 1.3. Photo: Stephen Pond

15. Brentford
Played: 10. Won: 2. Drawn: 4. Lost: 4. Goals For: 12. Goals Against: 10. Goal Difference: 2. Points: 10. Points Per Game: 1. Photo: Alex Burstow

16. Southampton
Played: 10. Won: 2. Drawn: 4. Lost: 4. Goals For: 10. Goals Against: 13. Goal Difference: -3. Points: 10. Points Per Game: 1. Photo: Pool