
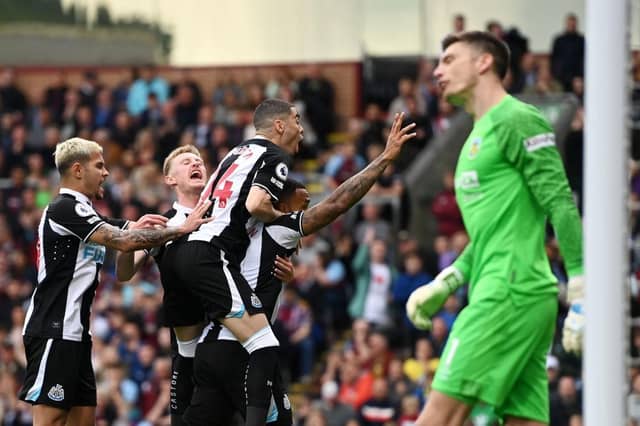

In football, the data suggests that the more a team spends on wages, the better they will perform on the pitch.
According to economist Stefan Szymanski, there is a ‘significant relationship between wages and league standing’ - something that has been evident in the Premier League again this season.
However, because of sport’s unpredictability, there have also been a few outliers to the theory this season.
Eddie Howe’s side secured an 11th place finish in the league this season – but how does that compare to their standing in the Premier League’s wage table?
Here, courtesy of data provided by football finance expert Kieran Maguire, we take a look at how the Premier League wage table looks based on the latest figures available and how each club performed against it this season.
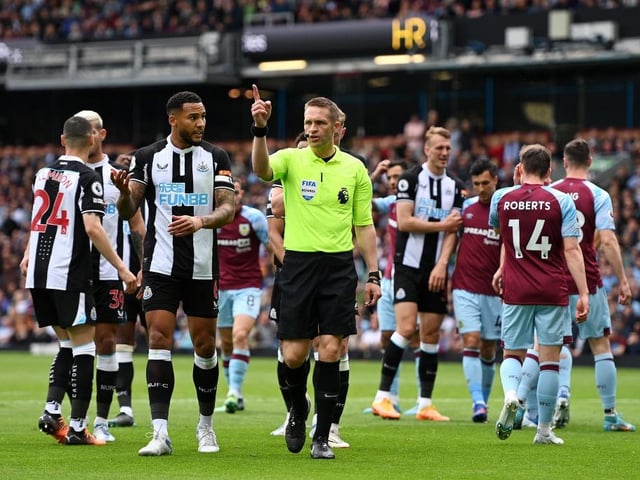
13. Newcastle United (£121,000,000)*
Spending on wages (*based on 11th month figure) = £121 million — position in Premier League table = 11th — position in wage table = 13th — difference = +2 Photo: Gareth Copley
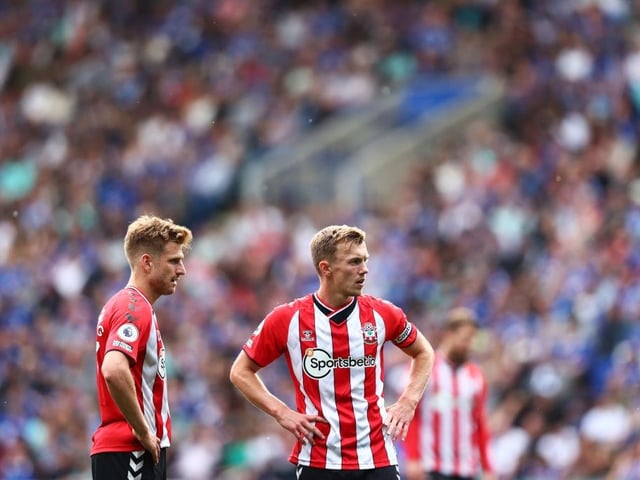
14. Southampton (£114,000,000)
Spending on wages = £114 million — position in Premier League table = 15th — position in wage table = 14th — difference = -1 Photo: Naomi Baker
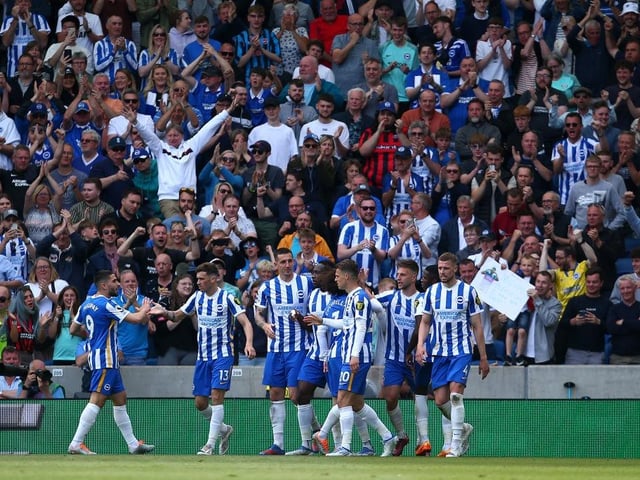
15. Brighton & Hove Albion (£109,000,000)
Spending on wages = £109 million — position in Premier League table = 9th — position in wage table = 15th — difference = +6 Photo: Charlie Crowhurst

16. Leeds United (£108,000,000)
Spending on wages = £108 million — position in Premier League table = 17th — position in wage table = 16th — difference = -1 Photo: Alex Davidson